Thanks for the explanations. But what am seeing is that if I feed a data
values for each clusters. My objective is to give a name to each cluster
based on the feature names closest to the centroids .
Post by Sebastian RaschkaHi, Jaganadh,
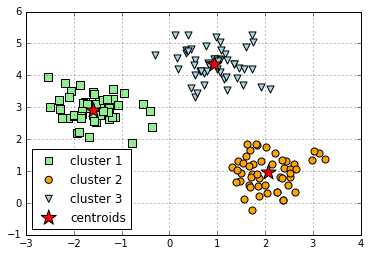
it looks like you ran k-means on a 2-dimensional dataset (i.e., a dataset
with 2 feature variables) and k=3. Thus, the results mean that these three
cluster centers (or âcentroidsâ) are the centers of the 3 clusters that
k-means attempted to discover. Or in other words, there are 3 globular
spheres with its center points
[ 1.01505989, -0.70632886], [ 0.33475124, 0.89126382], and
[-1.287003 , -0.43512572]
and each of the training points will be closest to one of these centroids,
which defines the cluster a training point has been assigned to. Hereâs a
figure of how it could look like when plotted in a 2D scatterplot,
https://raw.githubusercontent.com/rasbt/mlxtend/master/docs/sources/user_guide/cluster/Kmeans_files/Kmeans_17_0.png
Best,
Sebastian
Hi ,
After performing clustering, the cluster centers can be extracted via
.cluster_centers_.
A sample result is
kmeans.cluster_centers_
array([[ 1.01505989, -0.70632886],
[ 0.33475124, 0.89126382],
[-1.287003 , -0.43512572]])
How can I interpret these values.
Can somebody help me understanding this document bit detail
cluster_centers_ : array, [n_clusters, n_features]
Coordinates of cluster centers
--
**********************************
JAGANADH G
http://jaganadhg.in
ILUGCBE
http://ilugcbe.org.in
------------------------------------------------------------------------------
Find and fix application performance issues faster with Applications
Manager
Applications Manager provides deep performance insights into multiple
tiers of
your business applications. It resolves application problems quickly and
reduces your MTTR. Get your free trial!
https://ad.doubleclick.net/ddm/clk/302982198;130105516;z_______________________________________________
Scikit-learn-general mailing list
https://lists.sourceforge.net/lists/listinfo/scikit-learn-general
------------------------------------------------------------------------------
Find and fix application performance issues faster with Applications Manager
Applications Manager provides deep performance insights into multiple tiers of
your business applications. It resolves application problems quickly and
reduces your MTTR. Get your free trial!
https://ad.doubleclick.net/ddm/clk/302982198;130105516;z
_______________________________________________
Scikit-learn-general mailing list
https://lists.sourceforge.net/lists/listinfo/scikit-learn-general